Advantage+ Creative Enhancements: What to Check Before Black Friday
Meta switches on several Advantage+ creative enhancements and product browsing by default. What each one changes, which to keep, and how to test them on MER.
Strategy notes from the team managing paid media, retention, and CRO for eCommerce brands every day. No hype, just what the numbers say and what to do about it.
 Paid Media
Meta switches on several Advantage+ creative enhancements and product browsing by default. What each one changes, which to keep, and how to test them on MER.
 Growth Consulting
Most ecommerce marketing budget rules come from billion-dollar companies. Here's how to set your 2027 budget from contribution margin, MER and new customer CAC.
 Paid Media
Google moved many Search campaigns to AI Max in September. Here's what it switched on, where it overlaps brand search and PMax, and how to test it on revenue.
 CRO
AI personalization lifts ecommerce conversions ~40%, and personalized CTAs convert 202% better. What actually works in CRO right now, beyond A/B tests.
 Email & SMS
SMS flows drive 45% of SMS revenue from under 8% of sends. Get the 2026 playbook: which SMS automations to build, compliance rules, and email pairing.
 Paid Media
Key takeaways Run the after action report within 48 hours, on six questions, while everyone still remembers what happened. Do not treat those numbers as final. Around 17% of holiday sales come back as returns, and in one account we manage roughly 31% of conversions landed more than seven days after the click. Judge the […]
 Paid Media
First-party data now beats budget size as a paid media edge. Learn how to collect, structure, and feed customer data into Google and Meta for better ROAS.
 Paid Media
Platform ROAS tells you what your ads touched, not what they caused. Learn how to run incrementality tests that reveal what your paid media truly drives.
 Paid Media
Meta is projected to out-earn Google in ads for the first time ever. What the shift means for your media mix, and how to rebalance budgets for 2027.
 Paid Media
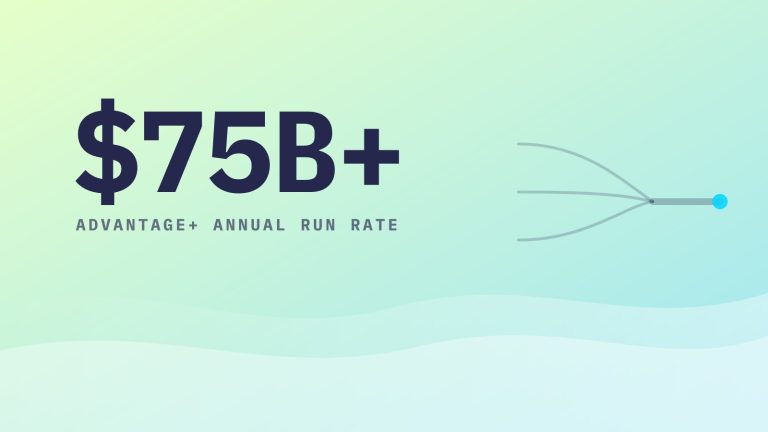
Advantage+ is now the default on Meta. Here is how to restructure your Meta ads account for the AI-default era without losing control of creative or spend.
 Paid Media
Retargeted shoppers convert up to 70% more often than cold traffic. Here’s the Meta ads funnel framework, plus Advantage+ and AOV tactics, that captures it.
 Paid Media
Over 60% of Google Ads spend now runs through Performance Max. Learn how to stop PMax from cannibalizing branded search, inflating ROAS, and hiding real costs.
 AI
AI-referred shoppers already convert better than typical traffic, and checkout is moving into AI itself. What ecommerce marketers should do about it now.
 Paid Media
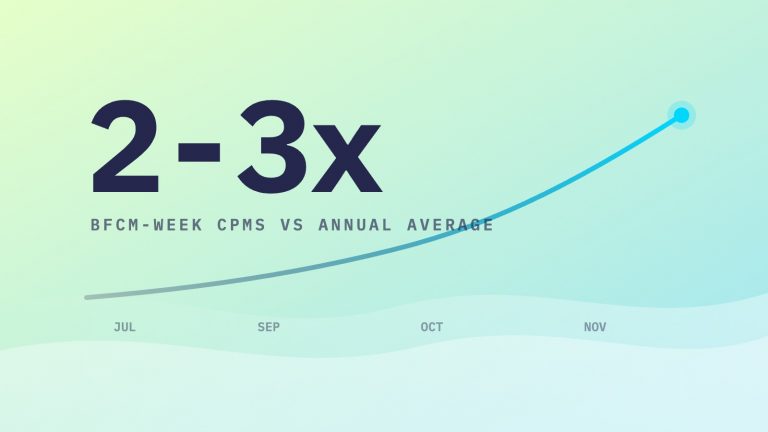
Q4 CPMs run 25-60% above annual average. Learn why winning BFCM paid media strategies start in July, and get our month-by-month planning framework.
 Growth Consulting
Revenue and traffic do not pay the bills. Learn why LTV, conversion rate, and MER are the three ecommerce metrics that actually determine profitability.
 Email & SMS
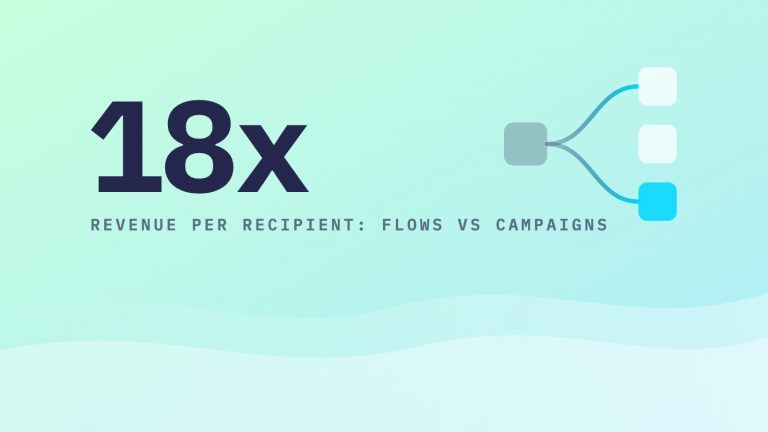
Email flows generate ~41% of email revenue from just 5.3% of sends. Here are the automated flows every ecommerce brand needs, and how to build them right.
 Growth Consulting
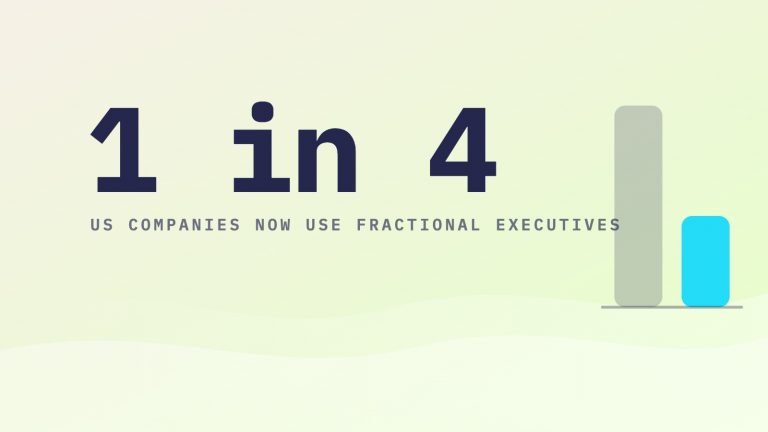
1 in 4 US companies now uses fractional executives. A practical framework for $1M-$10M brands deciding between a fractional CMO and a full-time hire.
Let's talk through what these strategies would look like applied to your brand.